Using SIMD + Caching To Render Audio Waveforms For FREEEE
Waveform rendering is too slow. Let's speed it up.
A stream of consciousness exploration of how I optimized waveform rendering in my audio application.
The Setting
I am creating a modern take on old school tracker style music production software. One big part of my UI is the ability to render waveforms. Right now, the main place it's featured is in the Sampler widget. The sampler let's a user see the waveform, zoom into different parts of it, place slice markers to control which part of the sample plays on each step of the track, etc, stock standard sampler features you'd expect from any digital audio workstation.
I notice the frame timing measurements that I display when running in dev mode, drop quite hard when I have a few samplers on screen, i.e. when rendering multiple waveforms at the same time. The drop isn't so severe on my machine that it impacts usability, but I'm running fairly powerful modern desktop class hardware.
At this point I'd like to point out, that I don't really care, and don't think the world really cares about, a new take on old school tracker-style audio production software, there are already many out there, and to overtake them isn't really my main goal.
The tracker is just a sample project, dogfood if you will, of my IMGUI library which I think the world does actually need, and is my main goal overall. I figured it was a decently complex enough UI that would test my library fairly well. So with that in mind, don't take the current UI layout / theme / graphics too seriously, if this project ever does become serious, much like a gamedev project, I would work on visual polish once I actually the full functionality. Consider it programmer art.
I do have BIG plans for the UI library, ultimately it will be a fully cross-platform application framework providing a developer experience on par with the latest and greatest web technologies (hot-reloading of all code, hot-swappable themes, inbuilt widget library, custom widget layer, etc.), whilst maintaining the performance and control one gets with lower level systems level programming.
Basically, I'm sick of using several gigabytes of RAM on my PC just to do a few trivial task simultaneously: i.e. running Spotify + Teams (for work :/) + Discord + Notion (jokes, I don't use Notion, garbage software). Things you could literally do, in nearly the same way (listen to music, instant message people / groups, take / organise notes) on a 2009 laptop with 2GB of RAM total. So this article is just to explore how I can optimize some part of an application built with my IMGUI library. Anyway enough ranting, onto the show.
The Technical Parts
Profiling
Let's begin with some 'profiling', as all sane optimization must. The quotes are because, my
profiling in this post just consists of a few timely placed RDTSC instructions (via Odin's time.now() function) to see how long certain blocks of code take to execute,
rather than busting open a full profiler. It should be good enough for our purposes.
At a high level the entire application is one for loop, something like:
for // ever {
    quit := app.update()
    if quit do app.shutdown()
}
Each iteration of this loop is a frame of our application, further in the post, we'll see what
type of work app.update() does.
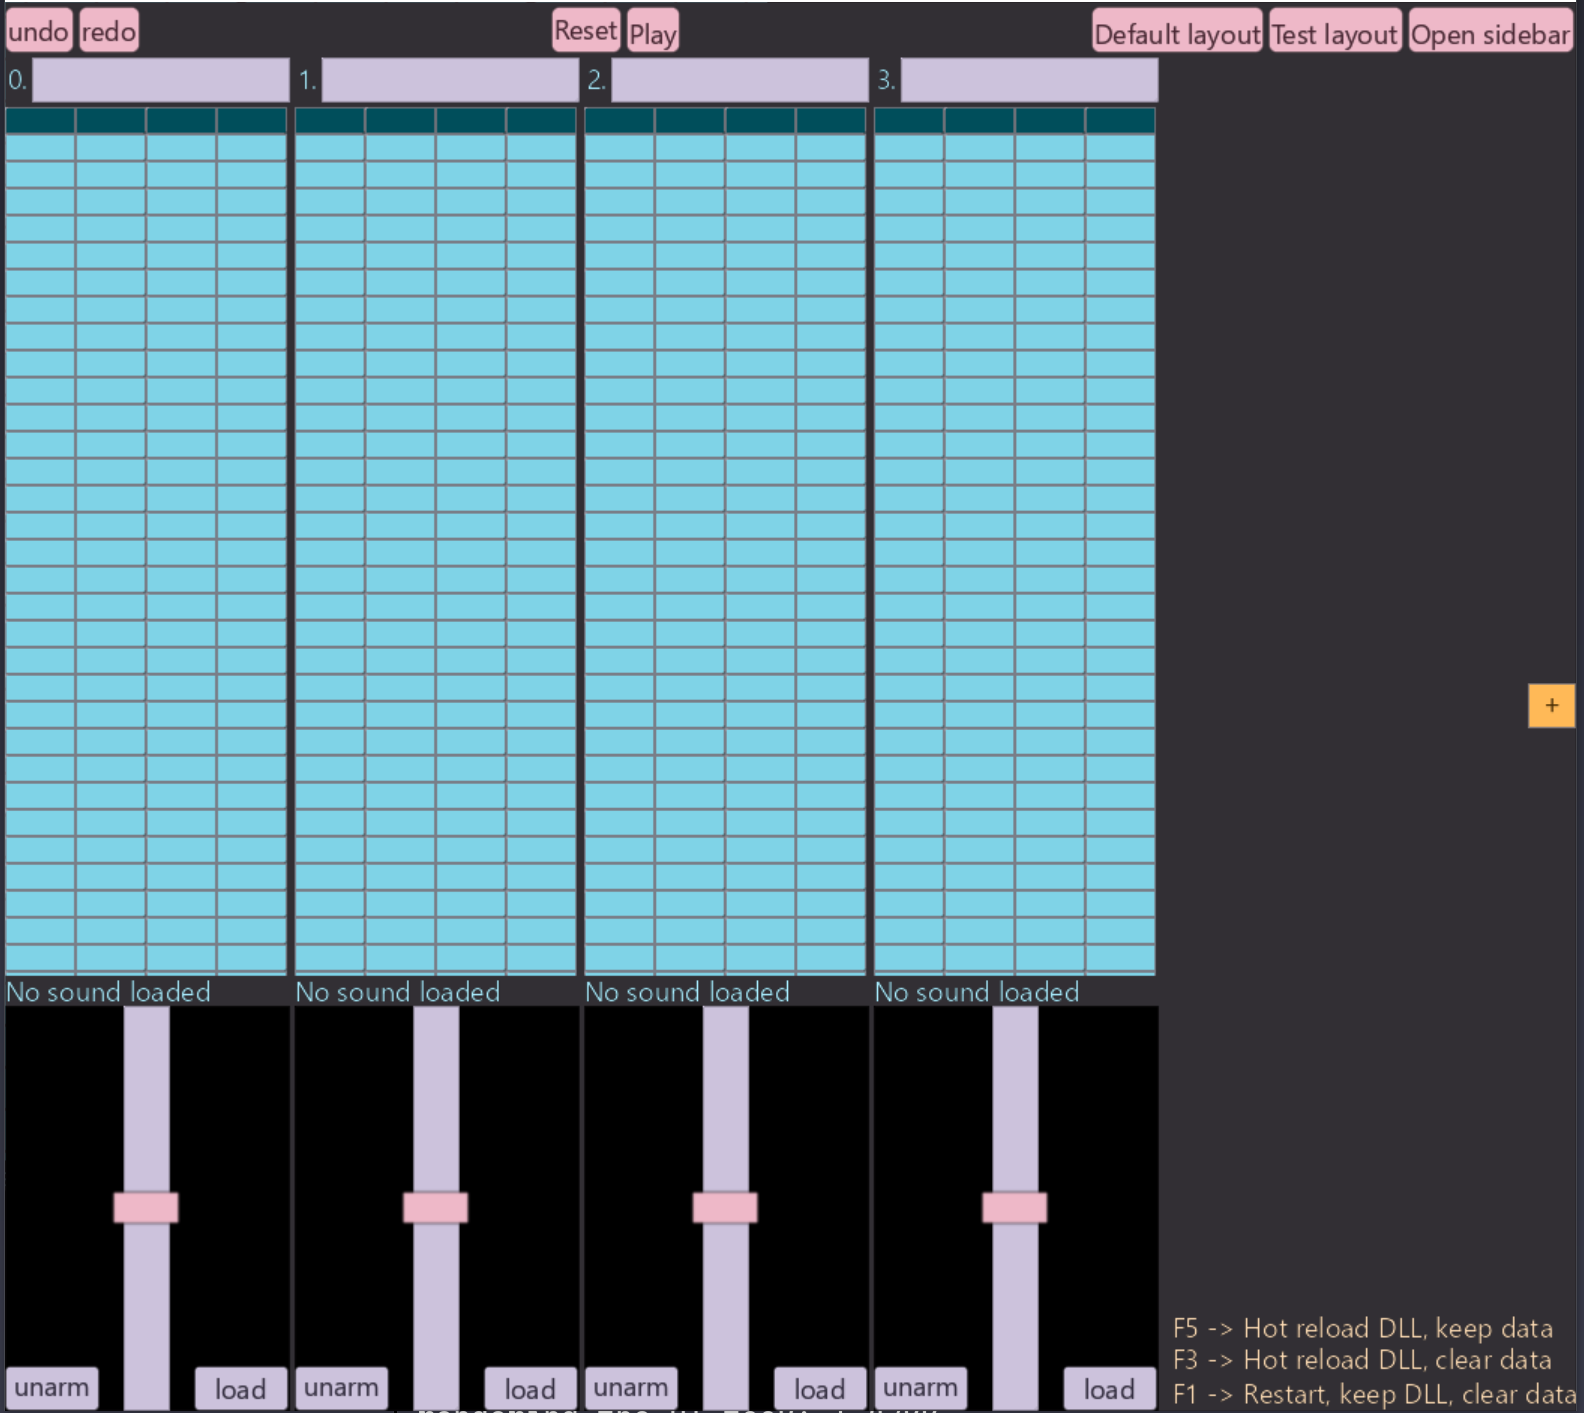
So with the application running, a sound loaded, but no sampler / waveform on screen, it looks like this:
Measuring how long each frame takes to run we get:
app_update() took 1.8596 ms
app_update() took 1.8626 ms
app_update() took 1.7977 ms
app_update() took 1.7627 ms
app_update() took 1.966 ms
app_update() took 1.7651 ms
app_update() took 1.7514 ms
app_update() took 1.7497 ms
app_update() took 1.9662 ms
app_update() took 2.2918 ms
app_update() took 2.0868 ms
app_update() took 1.8927 ms
app_update() took 1.7923 ms
app_update() took 1.8466 ms
app_update() took 1.8076 ms
app_update() took 1.7212 ms
app_update() took 1.7229 ms
app_update() took 1.7475 ms
app_update() took 1.6886 ms
app_update() took 1.9515 ms
app_update() took 1.7933 ms
app_update() took 1.7541 ms
app_update() took 1.6978 ms
app_update() took 1.81 ms
app_update() took 1.8349 ms
app_update() took 1.8232 ms
app_update() took 1.7916 ms
app_update() took 1.8645 ms
app_update() took 1.7999 ms
app_update() took 1.7688 ms
app_update() took 1.7395 ms
app_update() took 1.7387 ms
app_update() took 1.7468 ms
app_update() took 1.7335 ms
app_update() took 1.7385 ms
app_update() took 1.7656 ms
app_update() took 1.9038 ms
app_update() took 1.8268 ms
app_update() took 1.7478 ms
app_update() took 1.7724 ms
app_update() took 1.7393 ms
app_update() took 1.7261 ms
app_update() took 1.7075 ms
app_update() took 1.853 ms
app_update() took 1.9483 ms
app_update() took 1.7311 ms
app_update() took 1.8698 ms
app_update() took 1.7539 ms
app_update() took 1.6935 ms
app_update() took 1.8121 ms
app_update() took 1.7488 ms
app_update() took 1.751 ms
app_update() took 1.765 ms
app_update() took 1.7114 ms
app_update() took 1.7942 ms
app_update() took 1.7739 ms
app_update() took 1.8256 ms
app_update() took 1.8223 ms
app_update() took 1.7552 ms
app_update() took 2.0518 ms
app_update() took 1.7795 ms
app_update() took 1.7366 ms
app_update() took 1.8439 ms
app_update() took 2.1734 ms
app_update() took 1.7762 ms
This is running after we build with ./build/hot-reload-optimized.bat. All timed
runs of the program will be built with the exact same script. It builds our source code into a main executable and an app.dll, this is to enable hot-reloading.
This will add some runtime overhead, but that overhead will be constant across all runs of the
program.
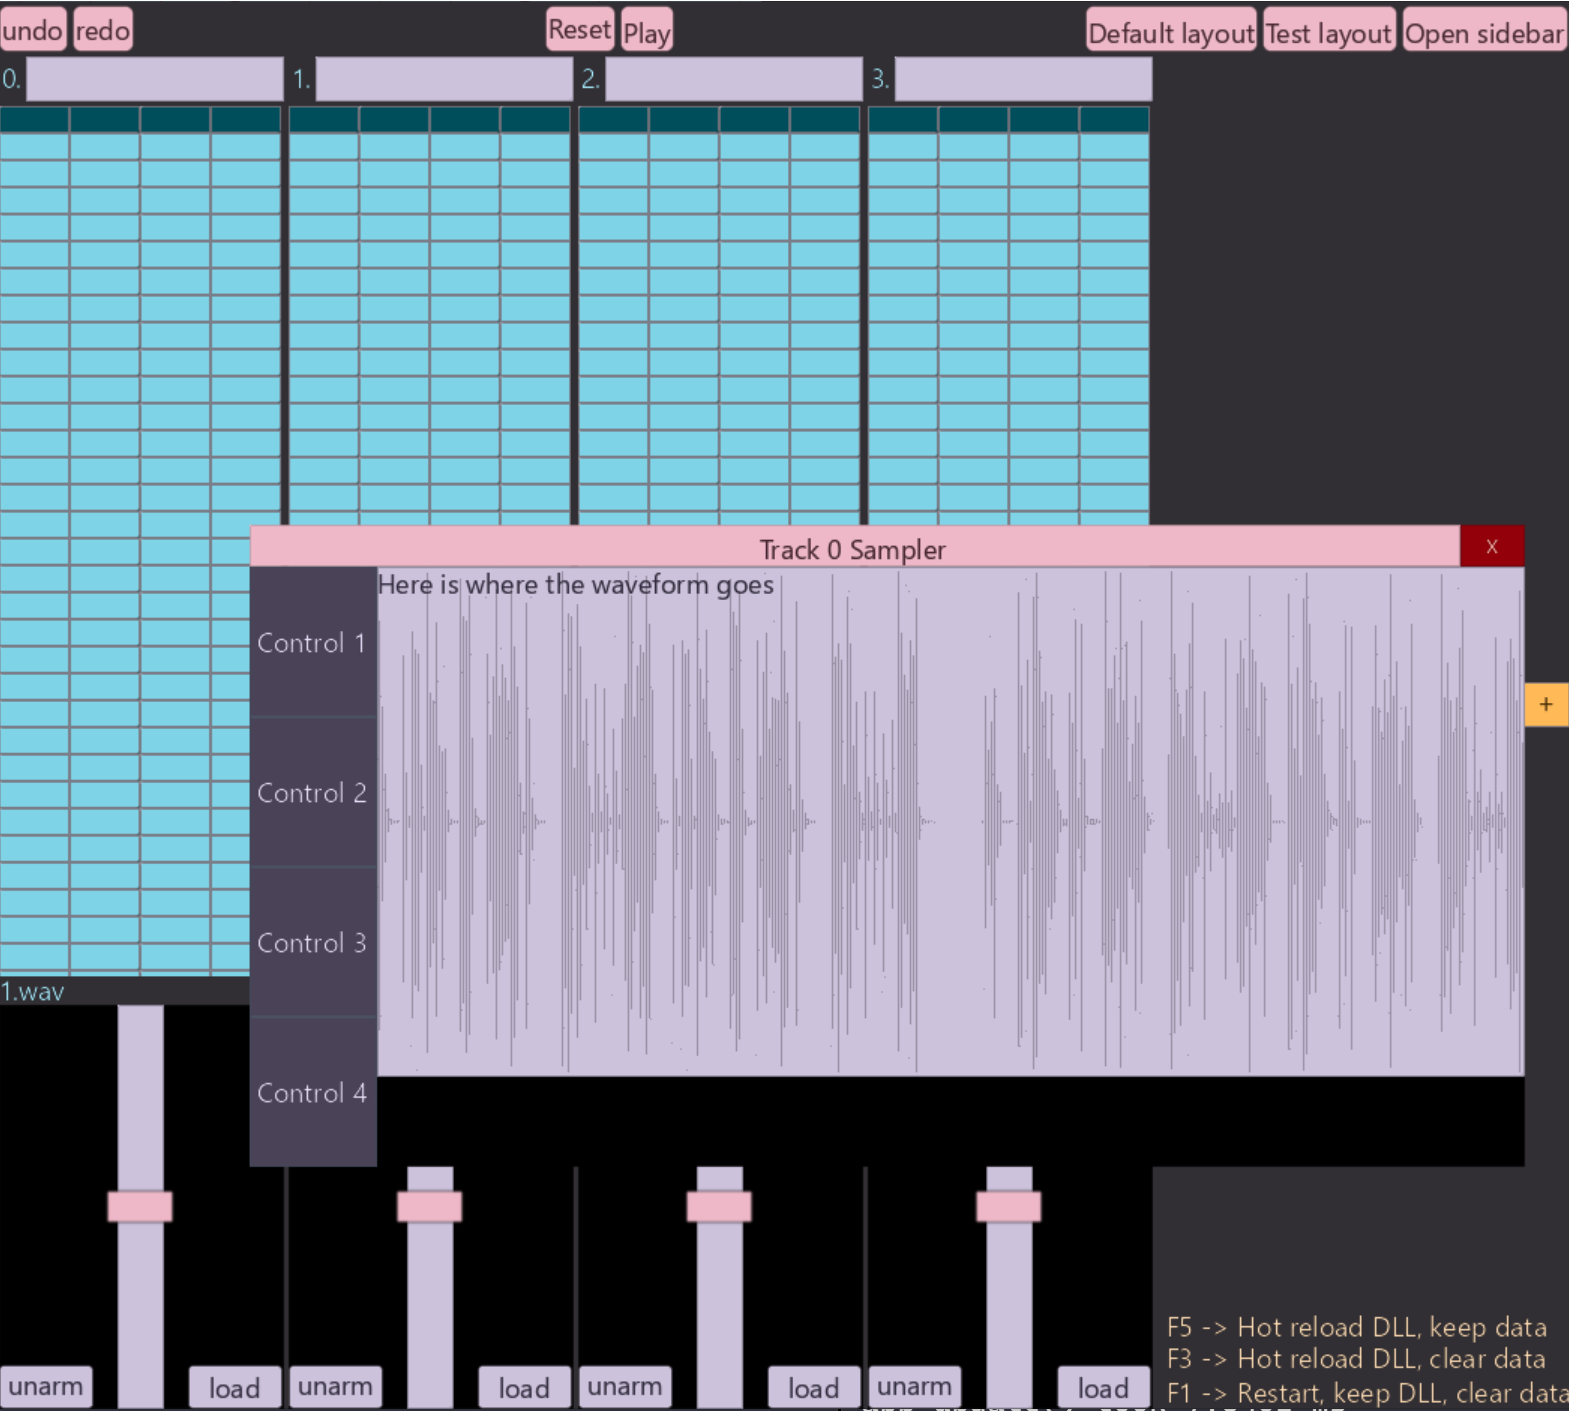
Loading a 15 second audio file: 1.wav into track 0 and opening the sampler of track
0, our UI now looks like:
With our frame time rising to:
app_update() took 2.8078 ms
app_update() took 2.7914 ms
app_update() took 3.126 ms
app_update() took 2.8663 ms
app_update() took 2.8915 ms
app_update() took 3.1378 ms
app_update() took 3.0016 ms
app_update() took 2.9419 ms
app_update() took 2.8684 ms
app_update() took 2.9049 ms
app_update() took 2.92 ms
app_update() took 3.0309 ms
app_update() took 2.9611 ms
app_update() took 2.8183 ms
app_update() took 2.8097 ms
app_update() took 3.0438 ms
app_update() took 2.902 ms
app_update() took 2.9783 ms
app_update() took 2.8506 ms
app_update() took 2.8371 ms
app_update() took 2.8863 ms
app_update() took 2.9158 ms
app_update() took 2.8463 ms
app_update() took 2.8666 ms
app_update() took 3.054 ms
app_update() took 2.9996 ms
app_update() took 2.9392 ms
app_update() took 3.0334 ms
app_update() took 3.0354 ms
app_update() took 2.8865 ms
app_update() took 2.9821 ms
app_update() took 2.923 ms
app_update() took 2.9195 ms
app_update() took 2.8747 ms
app_update() took 2.8983 ms
app_update() took 2.8283 ms
app_update() took 2.8835 ms
app_update() took 2.9716 ms
app_update() took 2.8488 ms
app_update() took 2.8346 ms
app_update() took 2.8844 ms
app_update() took 2.8203 ms
app_update() took 2.8826 ms
app_update() took 3.0732 ms
app_update() took 2.9744 ms
app_update() took 2.9015 ms
app_update() took 2.8576 ms
app_update() took 3.1644 ms
app_update() took 2.9596 ms
app_update() took 2.8523 ms
app_update() took 2.895 ms
app_update() took 2.8072 ms
app_update() took 2.8573 ms
app_update() took 2.9988 ms
app_update() took 2.9571 ms
app_update() took 2.9655 ms
So about a ~1.2ms increase in our frame time.
To diagnose what's causing the slowdown I've added some timestamping code in a few key places:
- Around our
sampler()function, which is what one may suspect is causing the slow down. - Around our
render_ui()call, just to see how much longer it takes to collect and send render data to the GPU.
With the sampler open, but no sound loaded into the track, and therefore no waveform drawn, we get:
render_ui: 0.5346ms    sampler: 0.0055ms    app_update: 1.9527ms
render_ui: 0.5347ms    sampler: 0.0053ms    app_update: 1.8476ms
render_ui: 0.5214ms    sampler: 0.0054ms    app_update: 1.8377ms
render_ui: 0.5368ms    sampler: 0.0054ms    app_update: 2.0202ms
render_ui: 0.545ms     sampler: 0.0057ms    app_update: 1.8735ms
render_ui: 0.6065ms    sampler: 0.0055ms    app_update: 1.9523ms
render_ui: 0.5734ms    sampler: 0.0057ms    app_update: 1.8829ms
render_ui: 0.565ms     sampler: 0.0052ms    app_update: 1.9015ms
render_ui: 0.5755ms    sampler: 0.0049ms    app_update: 1.9953ms
render_ui: 0.5556ms    sampler: 0.0055ms    app_update: 1.8719ms
Now with the sampler window still open, but with a sound loaded into the track and therefore a waveform being drawn, we get:
render_ui: 1.5702ms    sampler: 0.0059ms    app_update: 2.9827ms
render_ui: 1.5948ms    sampler: 0.0054ms    app_update: 3.0221ms
render_ui: 1.5989ms    sampler: 0.0057ms    app_update: 3.2601ms
render_ui: 1.5818ms    sampler: 0.0059ms    app_update: 3.064ms
render_ui: 1.5784ms    sampler: 0.0057ms    app_update: 3.1352ms
render_ui: 1.575ms     sampler: 0.0055ms    app_update: 3.0337ms
render_ui: 1.5747ms    sampler: 0.0059ms    app_update: 2.9464ms
render_ui: 1.6051ms    sampler: 0.0055ms    app_update: 3.1213ms
render_ui: 1.5945ms    sampler: 0.0055ms    app_update: 3.3046ms
render_ui: 1.5898ms    sampler: 0.0062ms    app_update: 2.9136ms
render_ui: 1.6466ms    sampler: 0.0057ms    app_update: 3.4331ms
Interesting.... What I can gleam from this, is that the logic inside the sampler() function isn't really taking up that much time. The bulk of the
slowdown is coming from having extra data to process when we render. Note the render_ui() is called inside app_update() so most of the extra time spent inside app_update() is actually just spent in render_ui().
Looking at my code this makes sense, the sampler() function doesn't actually handle
traversing the buffer and figuring out where to draw, it just handles a bunch of 'metadata' about
the sampler and creates a UI box configured such that the renderer will recognise it in the rendering
pipeline and draw the waveform there. It's in that rendering function where all the time is spent
and where we'll need to focus if we're to speed this up.
How the Waveform is Drawn
Let's talk through roughly how I draw the waveform now.
- When a sound is loaded into a track via miniaud.io, I
store the resulting PCM data in my own buffer. Now that I think about it, I can probably just query
miniaudiofor the PCM data when I need it? That's a problem for another day... - The main UI is made up of a bunch of tracks, each track has a corresponding sampler. You can
think of
sampler()as creating the UI of the surrounding window, buttons, etc you see around the waveform in the image, but it doesn't draw the actual waveform. For the waveform it simply creates a box with metadata that the renderer will handle:
// Inside here we'll render the waveform and the slice markers.
waveform_parent := child_container(
    {
        semantic_size = {{.Percent, 0.90}, {.Percent, 0.85}},
        color = .Secondary,
    },
    {},
    {.Draw, .Clickable, .Scrollable},
    Metadata_Sampler{
        track_num
    },
)
...
...
other sampler stuff, like controls, handling the creation of slices, etc.
...
...
Its main purpose is to provide a size for the container into which we'll draw the waveform (and slices), and also attach some metadata indicating that this is for the sampler, and the track number.
- The rendering pass runs after the UI is 'logically' created and laid out. UI creation is
essentially creating a tree of
Box's and the layout parses this tree and sets the position and size of everyBoxaccording to the data given in the creation phase.The part of the renderer relevant to drawing waveforms is this snippet:
for x in 0 ..< render_width {
    ratio_of_waveform := f64(x) / f64(render_width)
    start := start_sample + u64((f64(x) / f64(render_width)) * (f64(end_sample - start_sample)))
    end := start_sample + u64((f64(x + 1) / f64(render_width)) * (f64(end_sample - start_sample)))
    if end >= frames_read {end = frames_read}
    min: f32 = 1
    max: f32 = -1
    for i in start ..< end {
        if pcm_frames[i] < min {min = pcm_frames[i]}
        if pcm_frames[i] > max {max = pcm_frames[i]}
    }
    norm_x: f32 = f32(x) / f32(render_width)
    x_pos := f32(box.top_left.x) + norm_x * render_width
    y_top := f32(box.top_left.y) + (0.5 - max * 0.5) * render_height
    y_bot := f32(box.top_left.y) + (0.5 - min * 0.5) * render_height
    new_data := Rect_Render_Data {
        border_thickness = 300,
        corner_radius    = 0,
        edge_softness    = 0,
        top_left         = Vec2_f32{x_pos - 0.5, y_top},
        bottom_right     = Vec2_f32{x_pos + 0.5, y_bot},
    }
    if end <= pos_in_track {
        new_data.tl_color = played_color
        new_data.tr_color = played_color
        new_data.bl_color = played_color
        new_data.br_color = played_color
    } else {
        new_data.tl_color = unplayed_color
        new_data.tr_color = unplayed_color
        new_data.bl_color = unplayed_color
        new_data.br_color = unplayed_color
    }
    append(rendering_data, new_data)
}
In English:
- We figure out how wide the box we're rendering the waveform into is.
- We slice up our PCM frames into chunks, say there's 1,000,000 PCM frames for the sound and our box has a width of 400 pixels. Then each 'chunk' will be 1,000,000 / 400 = 2,500 PCM frames.
- We then iterate over this chunk finding the min and maximum sample value.
- We use this min / max to draw a line through that pixel inside the
waveform_containerbox. - We repeat this for every pixel of our box to draw the waveform.
There is some extra stuff going on since we're able to zoom into the waveform and only render a part of it, but we'll ignore that for now.
That rendering_data is a dynamic array that's passed in and out of various
rendering functions, ultimately building a flat list of Rect_Render_Data structs
which we pass to the GPU, run through shaders and put pixels on the screen. The fields of Rect_Render_Data are precisely the vertex values the GPU shader expects in order to
draw quads of a certain size, color, in a specific location, textured by a specific texture, etc,
etc, to achieve the effect of our desired UI.
(3 dot point version of how to do UI from scratch :) )
What Improvements Can We Make?
I can think of a few things:
1. CACHING CACHING CACHING!!
With the current setup, we literally do this entire 3 step procedure every single frame. In the future I am going to implement some mechanism in my UI library to skip all 3 steps if nothing has occurred (i.e. no user event / internal event / animation, etc), but right now this code runs every frame. So if it's going to run every frame, and compute the exact same waveform data every time (unless a user zooms in / loads a new sound), then we can cache the existing result and just load it in the next frame.
What could we cache?
- Well the entire point of this function is to generate a bunch of
Rect_Render_Data, we could cache those? But the problem is, we want to color a subsequence of the pixels differently depending on if that part of the sample has played yet or not. - A more flexible first approach would be to just cache the final
y_top,y_bottomandx_posvalues. Since I assume most of the time in that rendering code snippet, is spent calculating those 3 values for each pixel slice.
So we could end up with roughly:
- On the first frame (or when we don't have valid cached data), do the full computation, record some state that we can check against for invalidation.
- On the next frame see if our flags have been invalidated
- If so recompute.
- If not (which is often the case) use the cached values and skip A LOT of computations.
2. GOING WIDE (SIMD / parallelism)
Let's ignore parallelism for now since I don't have any of that infrastructure setup (thread pools / workers, etc) and spinning up threads for this one function wouldn't make sense since the overhead would be greater than the speedup. Instead we could use wide SIMD instructions.
The gist would be:
- Initialize a min vector:
{1, 1, 1, 1}and a max vector{-1, -1, -1, -1}. - Grab 4 - 8 samples (different architectures support differing widths of SIMD instructions) update the min vector and max vector.
- Once you've iterated the entire PCM buffer, we can simply take the min of the min vector and max of the max vector.
- And voila we've computed the exact same result, with 4 - 8x less CPU instructions. The speedup probably won't be 4-8x due to overhead and memory access bottlenecks, but it should be substantial.
3. GOING EVEN WIDER
GPUs are thicc thicc. Very wide, perfect for this kind of processing. However this approach has a trade-off.... and that is ... I don't exactly know how to do that yet and I won't be learning it right now :) But if the changes we make in this post don't lead to a great enough speed up, I will certainly be writing another article where we leverage the GPU for even greater gains.
The Plan
So what's the outcome? Here's my plan to optimize:
- Calculating the min / max of a chunk with SIMD.
- Caching that result, and only ever recalculating if the user changes the zoom level or pans around the sample.
- Hopefully that's good enough :)
Implementing SIMD Processing
Before diving in, lets see if we spend more time computing y_top, y_bot, x_pos,
or creating the Rect_Render_Data and appending to the render_data array. I've added similar timestep logging, this time around the code that does the y_top, y_bot, x_pos calculations, and around the part that creates the Rect_Render_data and appends it to render_data, giving us a more granular insight into where we
should focus our optimization efforts on.
spent 1.0913ms calcing    spent 0.0400ms creating render data
spent 1.0549ms calcing    spent 0.0366ms creating render data
spent 1.0168ms calcing    spent 0.0347ms creating render data
spent 1.0586ms calcing    spent 0.0291ms creating render data
spent 1.0300ms calcing    spent 0.0347ms creating render data
spent 1.0620ms calcing    spent 0.0337ms creating render data
spent 1.0161ms calcing    spent 0.0388ms creating render data
spent 1.0203ms calcing    spent 0.0308ms creating render data
As we can see, most of the time is spent computing y_top, y_bot, x_pos, so it's
these results that we will cache.
I do have one more concern, which is whether or not the optimizing mode of the Odin compiler + LLVM are already vectorising this code. Lets take a look at the disassembly to see if that's the case.
Using compiler explorer, it appears that even with the most aggressive optimization settings
of the Odin compiler -o:aggressive that inner for loop doesn't use SIMD.
I won't post the sample code and resultnig assembly here, but you can take my word for it, or checkout compiler explorer for yourself.
When doing optimization work, it's worth checking things like this, as modern compilers are a kind of black magic and will do sneaky useful things behind your back. Or you can just make your change and re-profile, depends on how complicated your optimizing change is.
So we shall continue on and implement it ourselves. Our new SIMD leveraging code looks like:
for x in 0 ..< render_width {
    ...
    //unchanged
    ...

    // Process 8 f32s at at time.
    SIMD_WIDTH :: 8
    mins:  #simd[SIMD_WIDTH]f32 = {1, 1, 1, 1, 1, 1, 1, 1}
    maxs:  #simd[SIMD_WIDTH]f32 = {-1, -1, -1, -1, -1, -1, -1, -1}
    for i := start; i < end - SIMD_WIDTH; i += SIMD_WIDTH {
        chunk := simd.from_slice(simd.f32x8, pcm_frames[i:i+SIMD_WIDTH])
        mins  = simd.min(mins, chunk)
        maxs  = simd.max(maxs, chunk)
    }

    min := simd.reduce_min(mins)
    max := simd.reduce_max(maxs)

    remaining_floats := (end - start) % SIMD_WIDTH
    for i := end - remaining_floats; i < end; i += 1 {
        if pcm_frames[i] < min { min = pcm_frames[i] }
        if pcm_frames[i] > max { max = pcm_frames[i] }
    }
    ...
    // same calculations of x,y values and creation of Rect_Render_Data as before
    ...
}
Let's run that and see if we get any speedups:
spent 0.3000ms calcing    spent 0.0286ms creating render data
spent 0.2761ms calcing    spent 0.0349ms creating render data
spent 0.3098ms calcing    spent 0.0303ms creating render data
spent 0.3247ms calcing    spent 0.0374ms creating render data
spent 0.3210ms calcing    spent 0.0391ms creating render data
spent 0.3323ms calcing    spent 0.0332ms creating render data
spent 0.3403ms calcing    spent 0.0344ms creating render data
spent 0.3362ms calcing    spent 0.0376ms creating render data
spent 0.4600ms calcing    spent 0.0454ms creating render data
spent 0.3076ms calcing    spent 0.0349ms creating render data
spent 0.3413ms calcing    spent 0.0383ms creating render data
And let's remove the extra logging inside the waveform rendering function, to make a fair
comparison with our first set of logging — just app_update and render_ui — we get:
render_ui: 0.9401ms
render_ui: 0.868ms
render_ui: 0.8766ms
render_ui: 0.8919ms
render_ui: 0.9326ms
render_ui: 0.9238ms
render_ui: 0.899ms
render_ui: 0.8917ms
render_ui: 0.931ms
render_ui: 0.9059ms
render_ui: 0.9277ms
render_ui: 1.0217ms
As we can see from the timing information:
- Calculating the height of each waveform pixel now takes 1/3 the time. That's a 200% speed up, or put another way, it runs 3x faster than it used to.
- Rendering the entire UI now takes 2/3 the time. That's a 50% speed up, or put another way, it runs 1.5x faster than it used to. The speed up here is less significant because there's other parts of the rendering pipeline that will be slowed down by having all the extra rendering data we add for the waveform.
That change probably took me 10-15 minutes to implement, the majority of that time was spent
reading the Odin docs since I haven't used Odin's simd package before; if I had, it
probably would've been a couple minutes in order to speed up an extremely costly part of my application.
While I'm happy with that speed up, I'd rather that log statement read something like:
spent 0.0ms calcing    spent 0.0303ms creating render data
spent 0.0ms calcing    spent 0.0374ms creating render data
spent 0.0ms calcing    spent 0.0391ms creating render data
spent 0.0ms calcing    spent 0.0332ms creating render data
spent 0.0ms calcing    spent 0.0344ms creating render data
spent 0.0ms calcing    spent 0.0376ms creating render data
spent 0.0ms calcing    spent 0.0454ms creating render data
spent 0.0ms calcing    spent 0.0349ms creating render data
And I think it should be mostly possible, because, from frame to frame, unless the user
scrolls around the waveform or moves the sampler's window around the screen, those y_top, y_bot, x_pos values, should be absolutely identical to the previous frame....
So, let's implement some caching!
Implementing Caching
The general strategy will be:
- Check various pieces of sampler state that would cause the
y_top, y_bot, x_posvalues of our waveform render data to be invalid. In my app right now this is:- The user zooms in.
- The user drags the sampler container around.
- The user loads a new audio file into the sampler.
This list may grow as the sampler becomes more featureful but it would probably amount to
storing a few extra bytes of state and updating a condition in an if statement (as
we'll see).
Zoom Invalidation
This only requires one additional piece of state: prev_zoom_amount. To actually
store the cached data we alter the Sampler struct to:
Sampler_State :: struct {
    ...
    ...
    existing fields
    ...
    ...
    prev_zoom_amount: f32,
    cached_sample_heights: [dynamic]Waveform_Sample_Render_Info
}

Waveform_Sample_Render_Info :: struct {
    x_pos, y_top, y_bottom: f32,
    // This is basically the last pcm_frame in the pixel chunk. Let's us know
    // if this pixel should be colored or not depending on where the playhead
    // of the sample is.
    end_pcm_frame: u64,
}
prev_zoom_amount is precisely what you'd think, the first line of the sampler() function does:
prev_zoom_amount = zoom_amountWe'll use this as part of our cache invalidation check in the waveform rendering code.
Re-positioning Invalidation
We also need a way of determining inside our rendering code, if the sampler window has moved from where it was in the previous frame (when we cached the data). Luckily, we already possess the necessary data; the function signature of the waveform rendering code is:
add_waveform_rendering_data :: proc(
    box: Box,
    track: ^Track,
    pcm_frames: [dynamic]f32,
    rendering_data: ^[dynamic]Rect_Render_Data,
)
That first argument box: Box, is the core building block of my entire UI library.
It basically follows Ryan Fleury's idea of a fat struct. It holds the fields:
Box :: struct {
    ...
    ...
    top_left:          [2]f32,
    bottom_right:      [2]f32,
    // new
    prev_top_left:     [2]f32,
    // new
    prev_bottom_right: [2]f32,
    ...
    ...
}
In my UI library, there are no separate structs / classes that describe a Button, Slider, Knob, TextBox, etc;
everything is a Box :: struct{...}. The renderer is an instanced quad
renderer, that along with other information, expects vertices to contain a top_left and bottom_right.
We've added a prev_top_left and prev_bottom_right, very similar to
the prev_zoom_point of the sampler, we set these at the beginning of the layout positioning
code. This let's us then check 2/3 of our cache invalidation conditions in the waveform renderer
like so:
if sampler.zoom_amount == sampler.prev_zoom_amount &&
   box.top_left == box.prev_top_left && box.bottom_right == box.prev_bottom_right
{
    for curr, i in sampler.cached_sample_heights {
        x_pos := curr.x_pos
        y_top := curr.y_top
        y_bot := curr.y_bottom
        pixels_end_pcm_frame := curr.end_pcm_frame
        new_data := Rect_Render_Data {
            // other rendering_data
            top_left         = Vec2_f32{x_pos - 0.5, y_top},
            bottom_right     = Vec2_f32{x_pos + 0.5, y_bot},
        }
        if pixels_end_pcm_frame <= pos_in_track {
            // color in one way.
        } else {
            // color in a different way.
        }
        append(rendering_data, new_data)
    }
else
{
    // Current state no longer corresponds with our cached data.
    // Run our optimised SIMD routine to recalculate waveform data.
}y_top, y_bot,x_pos; it's basically the cost of 1_000 (or however many pixels wide
the sampler container is) * 4 assignments. But, let's look at the overall app_update() loop time and render_ui time:
render_ui: 0.5735ms    app_update: 2.0195ms
render_ui: 0.5689ms    app_update: 1.9822ms
render_ui: 0.564ms     app_update: 1.9094ms
render_ui: 0.5916ms    app_update: 2.0783ms
render_ui: 0.5606ms    app_update: 1.8903ms
render_ui: 0.6147ms    app_update: 2.5987ms
render_ui: 0.8271ms    app_update: 1.9678ms
render_ui: 0.582ms     app_update: 1.9211ms
render_ui: 0.5728ms    app_update: 1.9729ms
render_ui: 0.5812ms    app_update: 1.9217ms
render_ui: 0.5782ms    app_update: 1.8876ms
render_ui: 0.5982ms    app_update: 1.9373ms
render_ui: 0.5733ms    app_update: 2.0318ms
And just like that, we're basically taking the same amount of time as we were in the first measurement, when we weren't rendering the sampler or waveform at all!
In a way rendering a waveform is now nearly free, which is important since we could be rendering 5+ samplers at once and each sampler, in the final version of the app, will have both the left and right channels displayed (right now it's only the left channel), so that original ~1ms slowdown for each waveform would have been something like a 10ms+ slowdown of the UI thread. That's still under something like a 120FPS frame budget on my relatively powerful Intel 13600kf, but we'd start dropping frames and lagging for the many many people who run less powerful hardware. That's a pretty good result!
I'll leave out the code for invalidating the cache and recalculating the data when we load a new sound, as this post is already too long and it's pretty trivial, it would basically just be:
- In the sound loading code, clear the dynamic array of the cached data.
- Pull out the existing waveform rendering code into a separate function and call it from inside the sound loading function to refill the cache.
While I'm happy with the speed up, I'm not exactly ecstatic about how the waveform ultimately looks, however I think that's a separate issue since to draw it more prettily, I'd require basically the same data but different code in the shader, which wouldn't really affect the CPU side runtime. Perhaps we'll talk about that in another post.
And that's all for now!
Tune In Next Time
Where I'll probably talk about:
- Optimizing even more hot paths of my UI — probably the code that handles 1000s of
Boxstructs each frame. - Writing a fairly non-shit multiband graphical EQ and spectrum analyser.
- Making my immediate mode UI as power efficient as your favourite retained mode UI.
- ....... something cool!